Getting Started
RigRite works by continuously calculating the forces in each part of the diagram as you drag it around. You can drag points to set the desired angles or use a photo to match a real world situation or rigging plan.
- Drag points around to match the rigging you want to calculate.
- Tap Photo to take a picture or choose one from your device.
- Use the photo slider to fade the photo and make your diagram more visible - or hide the photo completely.
- Tap Force to set the force and units. RigRite can handle any units, try 2kN, 80kg, 100%, 1, 1 person, 12 rocks…
There are three types of diagrams in RigRite. These are flexible enough to handle practically any vector force situation - they aren’t limited to the situations they are named after.
- Anchor - Calculate the loading in situations where force is supported by two parts of a system. Useful for anchors, tripod legs, highlines and more.
- Directional - Calculate the force on a redirect or tripod head.
- Slope - Calculate the force on the mainline for a slope raise or lower.
Anchor Diagram
The anchor diagram is used whenever the load is split and supported by two parts of the system. A two-point anchor is one example, but the diagram can be used to calculate the load on tripod legs, highlines and many other situations. See Advanced Use for more.
Note: When the force is shown as a red negative number and the line is dashed, it represents a compression force such as in a tripod leg rather than a tensile (pulling) force.
Why can’t you calculate a three point anchor?
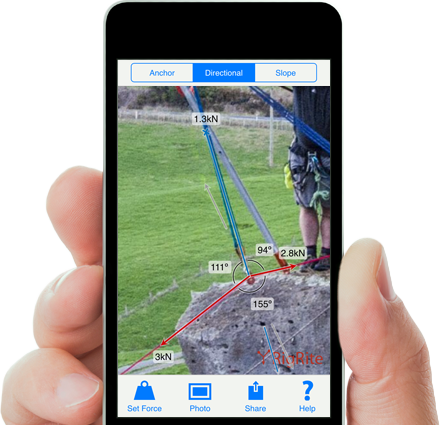
Directional Diagram
This diagram can be used for any situation where a load bearing rope is deflected (redirected). Common situations include simple redirects, high directionals such as tripods and gin-poles, and ropes running over edges or beams. The redirect force is shown in blue.
When there is no friction at the deflection point (as is often assumed for pulleys or in theoretical analysis) the resultant force will be perpendicular to the deflected rope, this is shown with the grey lines for reference. When friction is accounted for, the redirect may move off this theoretical line and the forces will become uneven.
More info on Redirect Friction.
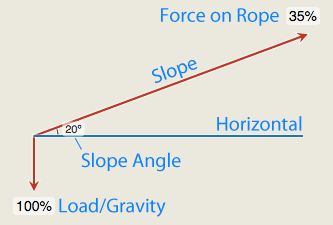
Slope Diagram
The slope diagram is used to calculate the theoretical load on the mainline in a slope raise/lower situation.
Note: The slope diagram is limited to theoretical loading. Friction plays a much bigger part in a slope raise/lower than it does in the situations represented in the other two diagrams. The friction of the load on the slope cannot be determined by the angles involved. Furthermore, if the load in question includes people who are walking on the slope, this complicates calculations further. For example, the people could lean back, pulling against the rope, which would increase the load. Alternatively, they could actively walk up the slope, thus decreasing the load.
Drag the top and bottom of the slope to match the situation you want to calculate. The blue horizon line will always be horizontal and the load line always points straight down (gravity).